标题:求帮写一个简单指标~
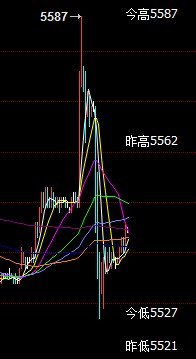
结合图片做一下说明,
如果上周的最高价超出了你当前范围,要压缩图形了,是不是就不要显示了?
是的,不用压缩图形,价格到了能看见就行了,太远了不显示,不然图会缩得很小了!
剩下的代码是:
今高:=callstock(stklabel,vthigh,6);
今低:=callstock(stklabel,vtlow,6);
昨高:=callstock(stklabel,vthigh,6,-1);
昨低:=callstock(stklabel,vtlow,6,-1);
上周高:=callstock(stklabel,vthigh,7,-1);
上周低:=callstock(stklabel,vtlow,7,-1);
drawtext(islastbar,今高,'今高'+numtostr(今高,2));
drawtext(islastbar,今低,'今低'+numtostr(今低,2));
drawtext(islastbar,昨高,'昨高'+numtostr(昨高,2));
drawtext(islastbar,昨低,'昨低'+numtostr(昨低,2));
drawtext(islastbar,上周高,'上周高'+numtostr(上周高,2));
drawtext(islastbar,上周低,'上周低'+numtostr(上周低,2));
效率真高啊,非常感谢!!!不过在1分钟图上看时数字看不清啊,麻烦版主给调整一下,或者连条直线出来会不会直观一些?我主要是想在价格快到这些价位的时候能清楚的提前看到!!!
你要看直线的话
今高:=callstock(stklabel,vthigh,6);
今低:=callstock(stklabel,vtlow,6);
昨高:=callstock(stklabel,vthigh,6,-1);
昨低:=callstock(stklabel,vtlow,6,-1);
上周高:=callstock(stklabel,vthigh,7,-1);
上周低:=callstock(stklabel,vtlow,7,-1);
把上面6句话里面的等号都去掉
 此主题相关图片如下:111.jpg
 此主题相关图片如下:1.png