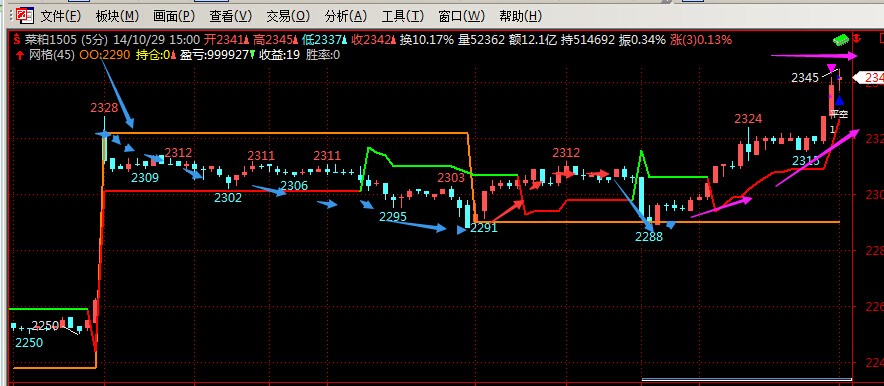
标题:前2段写好,请老师把第三段给写一下,附截图
//第一段是oo线的运行
input:grid(45,1,60,1);//申明并设置参数
variable:level=0;//为全局变量申明语句
dist:=barslast(date<>ref(date,1));
oo:ref(open,dist),COLOR0080FF,LINETHICK2;
zx:=c,COLORC080FF,LINETHICK1;
if holding=0 then begin
dnprice:=oo-grid*mindiff;
if low<=dnprice then begin
buy(1,1,limitr,dnprice);
level:=-1;
end
end
if holding=0 then begin
upprice:=oo+grid*mindiff;
if high>=upprice then begin
buyshort(1,1,limitr,upprice);
level:=1;
end
end
if holding>0 then begin
upprice:=oo+(level+1)*grid*mindiff;
dnprice:=oo+(level-1)*grid*mindiff;
if high>=upprice then begin
sell(1,1,limitr,upprice);
level:=level+1;
end
if low<=dnprice then begin
buy(1,1,limitr,dnprice);
level:=level-1;
end
if time=closetime(0) then
sell(1,holding,limitr,close);
end
if holding<0 then begin
upprice:=oo+(level+1)*grid*mindiff;
dnprice:=oo+(level-1)*grid*mindiff;
if low<=dnprice then begin
sellshort(1,1,limitr,dnprice);
level:=level-1;
end
if high>=upprice then begin
buyshort(1,1,limitr,upprice);
level:=level+1;
end
if time=closetime(0) then
sellshort(1,holding,limitr,close);
end
//第二段是红绿变色线的运行
VARIABLE: aspect=0; //初始化假定做多头
VARIABLE: stopprice=0;//止损价格变量
VARIABLE: stopnum = 10; //止损价差
RUNMODE:0; //工作于逐周期模式
if barpos = 0 then
stopprice := l - stopnum;
if aspect = 0 then
begin
//多头处理
if l <= stopprice then
begin
//多反空
aspect:= 1;
stopprice := h+stopnum;
end
//处理移动的底部
if l - stopnum > stopprice then
stopprice := l-stopnum;
end
if aspect = 1 then
begin
//空头处理
if h >= stopprice then
begin
//空反多
aspect:= 0;
stopprice := l-stopnum;
end
//处理移动的底部
if h + stopnum < stopprice then
stopprice := h+stopnum;
end
//画线
PARTLINE(aspect = 0, stopprice , colorrgb(255,0,0)),LINETHICK2;
PARTLINE(aspect = 1, stopprice , colorrgb(0,255,0)),LINETHICK2;
//第三段:运行要求:1、oo线下做空,空单持有到红绿线,直到oo线下来,平空单,反手开多单;
多单到红绿线平仓,等待;
最新价再次触及oo线,oo线上再次开多一直持有,收盘前14:59平多;
老师给写一下吧!谢谢!
空单持有到红绿线,直到oo线下来,平空单,反手开多单;
多单到红绿线平仓,等待;
请阐述一下红绿线和oo线的关系,以及是否和当前k线的行情有关
1、最新价C<=OO线,并且,oo线直行;开空(这时价格运行在oo线和红线之间);
2、红线变绿,最新价C与红绿线“死叉”,继续持有空单(这时价格运行在oo线和绿线之下);
3、oo线和红绿线“死叉”,oo线在最新价之下,平空翻多(这时价格运行在oo线之上红绿线之下);样描述可以吧
老师:可把这2段程序运行一下,就看到数值了
空单持有到红绿线,直到oo线下来
指的是oo线突破红绿线,降到红绿线之下?
老师:图形显示的很清楚,运行一下两端程序,看看就会明白;图形的走法
|
1、最新价C<=OO线,并且,oo线直行;开空(这时价格运行在oo线和红线之间); 2、红线变绿,最新价C与红绿线“死叉”,继续持有空单(这时价格运行在oo线和绿线之下); 3、oo线和红绿线“死叉”,oo线在最新价之下,平空翻多(这时价格运行在oo线之上红绿线之下);样描述可以吧 |
我这样描述的还不清楚?
 此主题相关图片如下:未命名.jpg