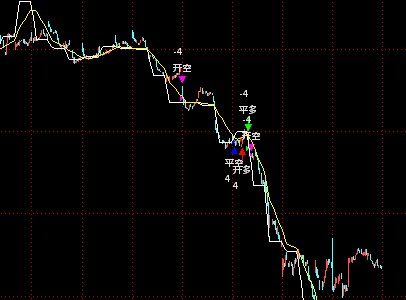
标题:双周期交易问题
cc:=CALLSTOCK(STKLABEL,VTCLOSE,6);
c5:=CALLSTOCK(STKLABEL,VTCLOSE,2);
jx5:=ma(cc,5);
jx20:=ma(cc,20);
jx5f5:=ma(c5,5);
jx5f20:=ma(c5,20);
f5:=ref(jx5f5,1);
f20:=ref(jx5f20,1);
money:=holding*c;
total0:=money+cash(0);
total1:=money+cash(1);
if jx5>jx20 then
begin
sellshort(holding<0,0,thisclose);
buy(jx5f5>jx5f20 and f5<f20 and holding=0,40%,thisclose);
end
if jx20>jx5 then
begin
sell(holding>0,0,thisclose);
buyshort(jx5f5<jx5f20 and f5 > f20 and holding=0,40%,thisclose);
end
一个5分钟MA5,MA20 一个日图MA5,MA20 为啥编了应用于图显示不出?
刚测了一下,开平仓信号是有的,如果要显示ma均线,就不要用中间变量的形式表示ma
cc:=CALLSTOCK(STKLABEL,VTCLOSE,6);
c5:=CALLSTOCK(STKLABEL,VTCLOSE,2);
jx5:ma(cc,5);
jx20:ma(cc,20);
jx5f5:=ma(c5,5);
jx5f20:=ma(c5,20);
f5:=ref(jx5f5,1);
f20:=ref(jx5f20,1);
money:=holding*c;
total0:=money+cash(0);
total1:=money+cash(1);
if jx5>jx20 then
begin
sellshort(holding<0,0,thisclose);
buy(jx5f5>jx5f20 and f5<f20 and holding=0,40%,thisclose);
end
if jx20>jx5 then
begin
sell(holding>0,0,thisclose);
buyshort(jx5f5<jx5f20 and f5 > f20 and holding=0,40%,thisclose);
end
啥意思,我是新手,没听懂,你的意思是这个程序能交易但是不显示?还是啥问题?我只会用CALLSTOCK表示,你有别的表示方法么?能教我吗?
:= 是中间变量,你用这个表示是不会显示线的
: 是变量,是会在图上有显示的
你只要把:=改为: 就显示了
而且5分钟图很多交易信号,日图基本没有信号
 此主题相关图片如下:7`fon2euq@ug{fsc6m2tjwf.jpg