共5 条记录, 每页显示 10 条, 页签:
[1]
[浏览完整版]
标题:[求助]能不能在主图k线上动态显示波动数值
1楼
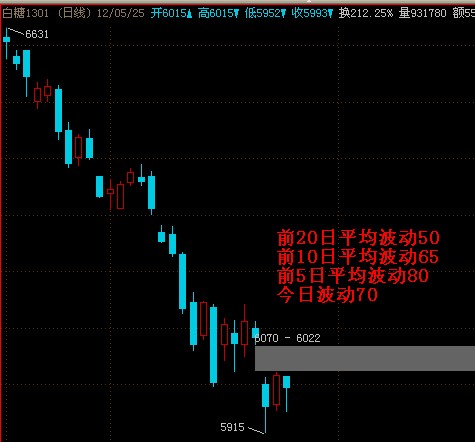
新居家 发表于:2012/5/27 17:34:30波动定义是指当日最高价减当日最低价
2楼
guotx2010 发表于:2012/5/27 21:46:07b20:ma((h-l),20),nodraw;
b10:ma((h-l),10),nodraw;
b1:h-l,nodraw;
drawtextex(1,0,0,0,'20日波动:'+numtostr(b20,1)+',10日波动:'+numtostr(b10,1)+',今日波动:'+numtostr(b1,1)),colorwhite; //写到公式下面行
drawtext(islastbar,h,'20日波动:'+numtostr(b20,1)+'\n10日波动:'+numtostr(b10,1)+'\n今日波动:'+numtostr(b1,1)),colorwhite,pxup50; //写到最后一根K线
[此贴子已经被作者于2012-5-27 21:46:29编辑过]
3楼
guotx2010 发表于:2012/5/27 21:53:02上述代码漏掉了5日平均波幅,你自己照葫芦画瓢,就行了吧!
4楼
新居家 发表于:2012/5/28 10:37:31多谢。我做好了问题位置摆得不对怎么办?太靠右了。

![]()
5楼
董小球 发表于:2012/5/28 14:44:57那你就别再最后一根K线上输出呗,找前面一点的K线输出
共5 条记录, 每页显示 10 条, 页签:
[1]
 此主题相关图片如下:z1fje%yhg9r`y9ujjwm3v.jpg