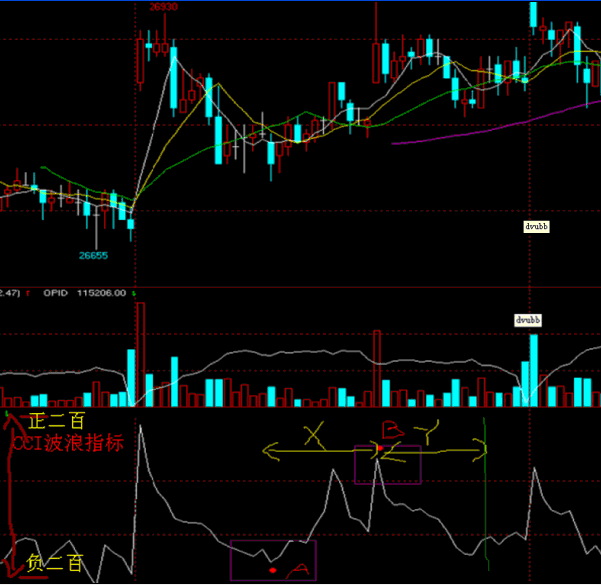
标题:取顶底周期值,在未来画竖线 咋整 亲!
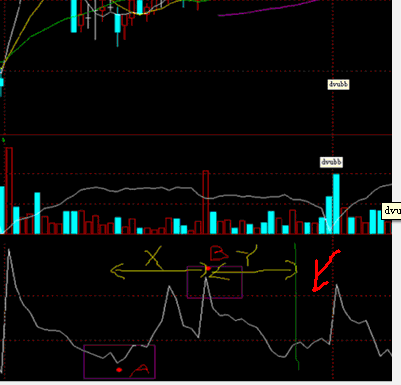
假如 五十个周期内, 在九点十分出现cci 数值的顶数值 180(cci 指标在正负200浮动),在九点三十出现cci数值的底-170,数值,(是一分钟k线图)这顶和底的时间周期差是二十, 然后在九点三十为起点 加上二十 九点五十的位置画条竖线 |
x1:=hhv(cci,50);
x2:=llv(cci,50);
x:=abs(x1-x2);
cond1:=between(cci,-200,200);
cond2:=x>300;
a1:=valuewhen(x1=c,time);
a2:=valuewhen(x2=c,time);
a3:=abs(a1-a2);
if cond1 and cond2 then begin
VERTLINE(a1+a3,high ,low);
VERTLINE(a2+a3,high ,low);
a1:=valuewhen(x1=c,time);
a2:=valuewhen(x2=c,time);
a3:=abs(a1-a2);
if cond1 and cond2 then begin
VERTLINE(a1+a3,high ,low);
VERTLINE(a2+a3,high ,low);
语言说 缺少 end 实在结尾 填写吗?
a1:=valuewhen(x1=c,time);
a2:=valuewhen(x2=c,time);
这两个语句是说 取值顶底 的时间点?
VERTLINE(a1+a3,high ,low);
VERTLINE(a2+a3,high ,low);
例子中 算出顶底二十的时间差后 在 九点三十 加时间差 二十 九点五十的位置 画条竖线 vertline 是直接耶
1 end是在您所指的地方添加 每个if对应一个end
2 当前收盘价为X1的时候,取时间
a1:=valuewhen(x1=c,time);
a2:=valuewhen(x2=c,time);
这个c 是什么量?
 此主题相关图片如下:321.gif
