- 金字塔客服中心 - 专业程序化交易软件提供商 (http://weistock.com/bbs/index.asp)
-- 公式模型编写问题提交 (http://weistock.com/bbs/list.asp?boardid=4)
---- 图表策略信号显示混乱,附源码 (http://weistock.com/bbs/dispbbs.asp?boardid=4&id=154780)
-- 发布时间:2017/6/6 10:39:11
-- 图表策略信号显示混乱,附源码
//开多条件
隔夜收盘开多:=KD01>0;
a2:=(KD02+KD03)>0;//开盘开多
//开空条件
隔夜收盘开空:=KK01>0;
b2:=(KK02+KK03)>0;//开盘开空
variable:flag=0;// 全局变量,买开仓时赋值为1
//交易系统1
开多: if todaybar=1 then buy(a2 and HOLDING=0,ss,limitr,open+MINDIFF);
开空: if todaybar=1 then buyshort(b2 and HOLDING=0,ss,limitr,open-MINDIFF);
//日内收盘平仓1
if time>=closetime(4)-5*100 then begin
平多:sell(1,ss,market);
平空:sellshort(1,ss,market);
end
//交易系统2
if KD01>0 and timetot0(dynainfo(207))<(timetot0(closetime(0))-60) and holding=0 then
begin
buy(1,ss,thisclose);
flag:=1;
end
if holding>0 and flag=0 then sell(1,ss,market);//次日开盘平多
if time=opentime(2) then flag:=0;//flag赋值为0
if KK01>0 and timetot0(dynainfo(207))<(timetot0(closetime(0))-60) and holding=0 then
begin
buyshort(1,ss,thisclose);
flag:=1;
end
if holding>0 and flag=0 then sellshort(1,ss,market);//次日开盘平空
if time=opentime(2) then flag:=0;//flag赋值为0
帮忙看看。哪里出问题?
-- 发布时间:2017/6/6 10:44:04
--
具体说明下什么样的混乱。
-- 发布时间:2017/6/6 10:50:17
--
您具体描述下什么混乱?信号还是下单?
-- 发布时间:2017/6/7 0:34:06
--
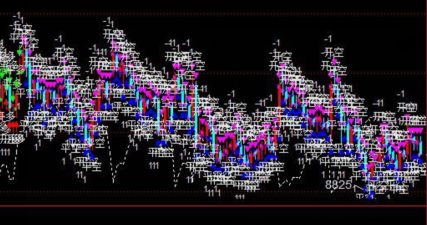
混乱
-- 发布时间:2017/6/7 0:40:33
-- 图表
图表
-- 发布时间:2017/6/7 0:41:51
--
信号在5分当天K上,每条都出现,一大饼
-- 发布时间:2017/6/7 8:43:48
--
截图看下你的信号情况,指出哪些是你认为不应该有的信号
[此贴子已经被作者于2017/6/7 8:50:13编辑过]
-- 发布时间:2017/6/7 12:43:39
-- 图表
图传不上
 此主题相关图片如下:1.png
-- 发布时间:2017/6/7 12:58:30
--
time>=closetime(4)-5*100
收盘前提前5分钟?上边写法不对
m5:=(t0totime(timetot0(closetime(0))-60*5));
time>=m5