- 金字塔客服中心 - 专业程序化交易软件提供商 (http://weistock.com/bbs/index.asp)
-- 公式模型编写问题提交 (http://weistock.com/bbs/list.asp?boardid=4)
---- 取顶底周期值,在未来画竖线 咋整 亲! (http://weistock.com/bbs/dispbbs.asp?boardid=4&id=11083)
-- 发布时间:2012/4/16 9:52:56
-- 取顶底周期值,在未来画竖线 咋整 亲!
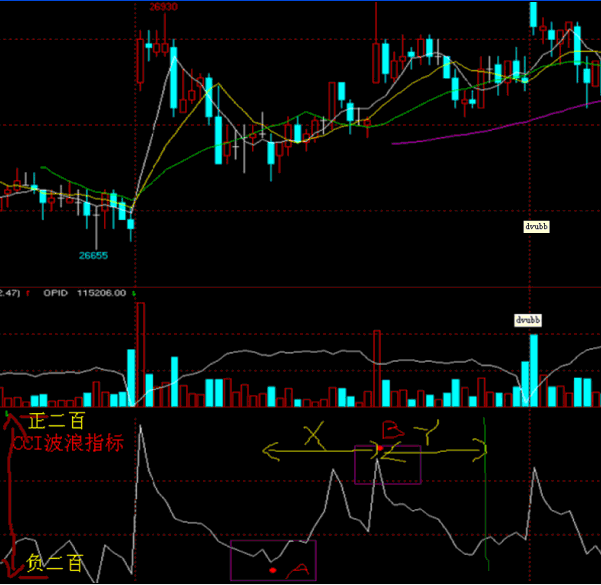
语言思路, 在五十个周期内, 取得 cci最大值, 最小值(且最大值与最小指的差的绝对值大于三百)(cci指标在正负200波动)算取 他们之间的时间周期。然后在末端峰值那个时间点(无论是后底或者后顶),加上刚才算出来的时间差,画条竖线。
假如 五十个周期内, 在九点十分出现cci 数值的顶数值 180(cci 指标在正负200浮动),在九点三十出现cci数值的底-170,数值,(是一分钟k线图)这顶和底的时间周期差是二十, 然后在九点三十为起点 加上二十 九点五十的位置画条竖线 |
-- 发布时间:2012/4/16 10:01:17
--
工作人员在处理,稍后回复
-- 发布时间:2012/4/16 10:24:42
-- ~!:) 麻烦了 亲
麻烦了 亲
-- 发布时间:2012/4/16 10:52:51
-- ~:)
?亲
-- 发布时间:2012/4/16 12:29:08
--
x1:=hhv(cci,50);
x2:=llv(cci,50);
x:=abs(x1-x2);
cond1:=between(cci,-200,200);
cond2:=x>300;
a1:=valuewhen(x1=c,time);
a2:=valuewhen(x2=c,time);
a3:=abs(a1-a2);
if cond1 and cond2 then begin
VERTLINE(a1+a3,high ,low);
VERTLINE(a2+a3,high ,low);
[此贴子已经被作者于2012-4-16 12:46:12编辑过]
-- 发布时间:2012/4/16 13:32:28
--
a1:=valuewhen(x1=c,time);
a2:=valuewhen(x2=c,time);
a3:=abs(a1-a2);
if cond1 and cond2 then begin
VERTLINE(a1+a3,high ,low);
VERTLINE(a2+a3,high ,low);
语言说 缺少 end 实在结尾 填写吗?
a1:=valuewhen(x1=c,time);
a2:=valuewhen(x2=c,time);
这两个语句是说 取值顶底 的时间点?
VERTLINE(a1+a3,high ,low);
VERTLINE(a2+a3,high ,low);
例子中 算出顶底二十的时间差后 在 九点三十 加时间差 二十 九点五十的位置 画条竖线 vertline 是直接耶
-- 发布时间:2012/4/16 13:32:48
-- 谢谢亲
谢谢亲!
-- 发布时间:2012/4/16 13:38:31
--
1 end是在您所指的地方添加 每个if对应一个end
2 当前收盘价为X1的时候,取时间
-- 发布时间:2012/4/16 13:55:22
-- 亲~
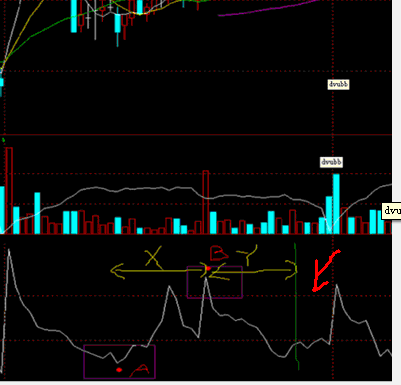
按照刚才的语句 在图中 画条 竖线~ 绿的那条 VERTLINE(a1+a3,high ,low); vertline 是横线也
-- 发布时间:2012/4/16 14:02:22
-- 哪位大师能帮我写个这个
a1:=valuewhen(x1=c,time);
a2:=valuewhen(x2=c,time);
这个c 是什么量?
 此主题相关图片如下:321.gif
